The goal
An earlier offshore wind farm proposed near Omø, Omø Syd, was rejected because it lay inside a protected nature area. This course project planned a replacement: a new site south of Omø, a farm of 27 Vestas V164 8 MW turbines (216 MW), an estimate of its yearly energy production, and an assessment of whether it would pay off.
My involvement
Responsible for the site selection and environmental impact assessment, the wind resource assessment in WAsP, the layout, IEC site assessment and energy-yield calculations in WAsP and WAT, and the grid connection and foundation choice.
Choosing the site
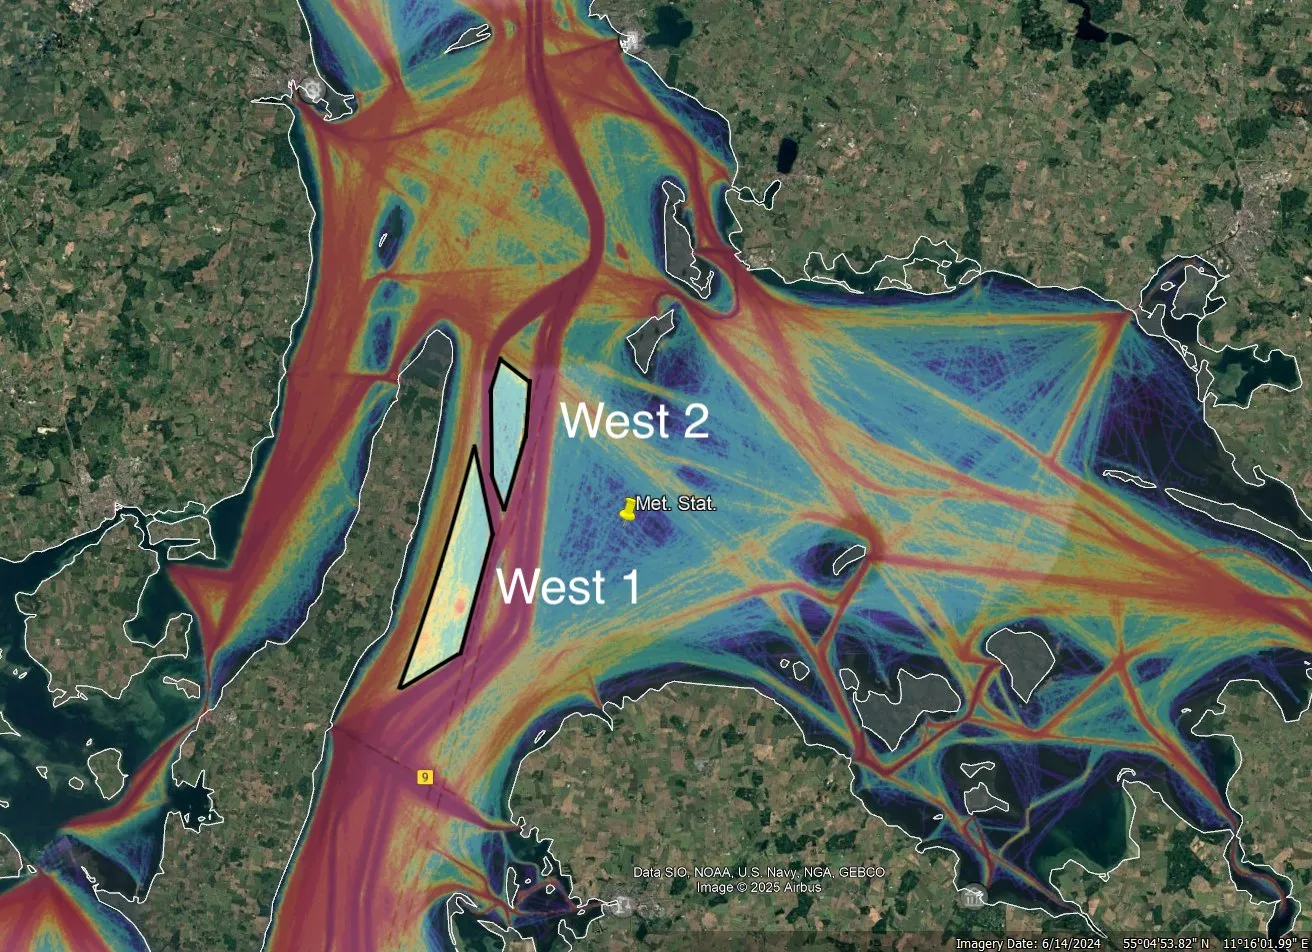
Ship traffic, protected areas and nearby wind farms around Omø were mapped, and the farm was placed at two sites west of the main shipping lane (West 1 and West 2). They lie outside the protected areas and close to Nakskov harbour, which has a Vestas factory. Three alternative sites had better wind, but all of them lie inside protected areas.
Wind resource
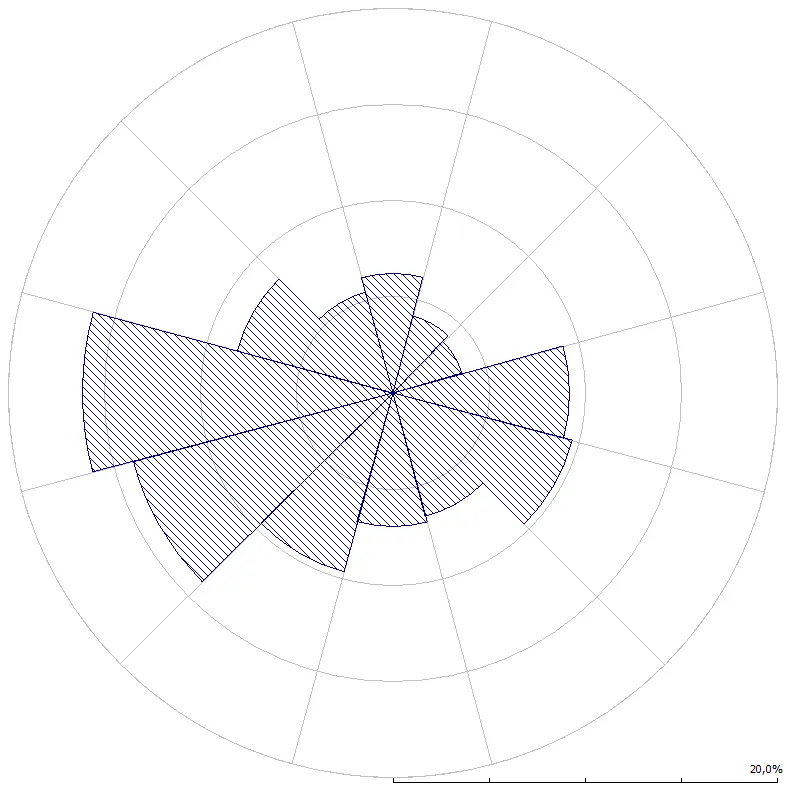
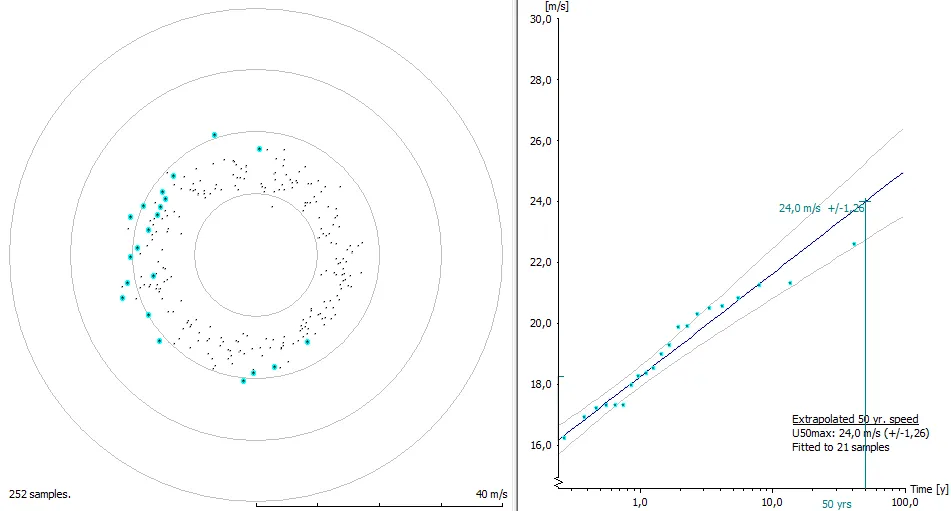
The met mast had about three years of 10-minute data at 51 m. A winter gap ruled out two consecutive years, so two separate full years were used. More than 97% of the readings were valid in both years. WAsP Climate Analyst gave a generalised mean wind of 6.9 m/s at 10 m, mostly from the west. For the 50-year extreme wind, the spectral-correction method gave 24 ± 1.3 m/s at 10 m. The annual-maximum and peak-over-threshold methods agreed with this, but with much larger uncertainty, because two years give them too few samples.
Layout and site assessment
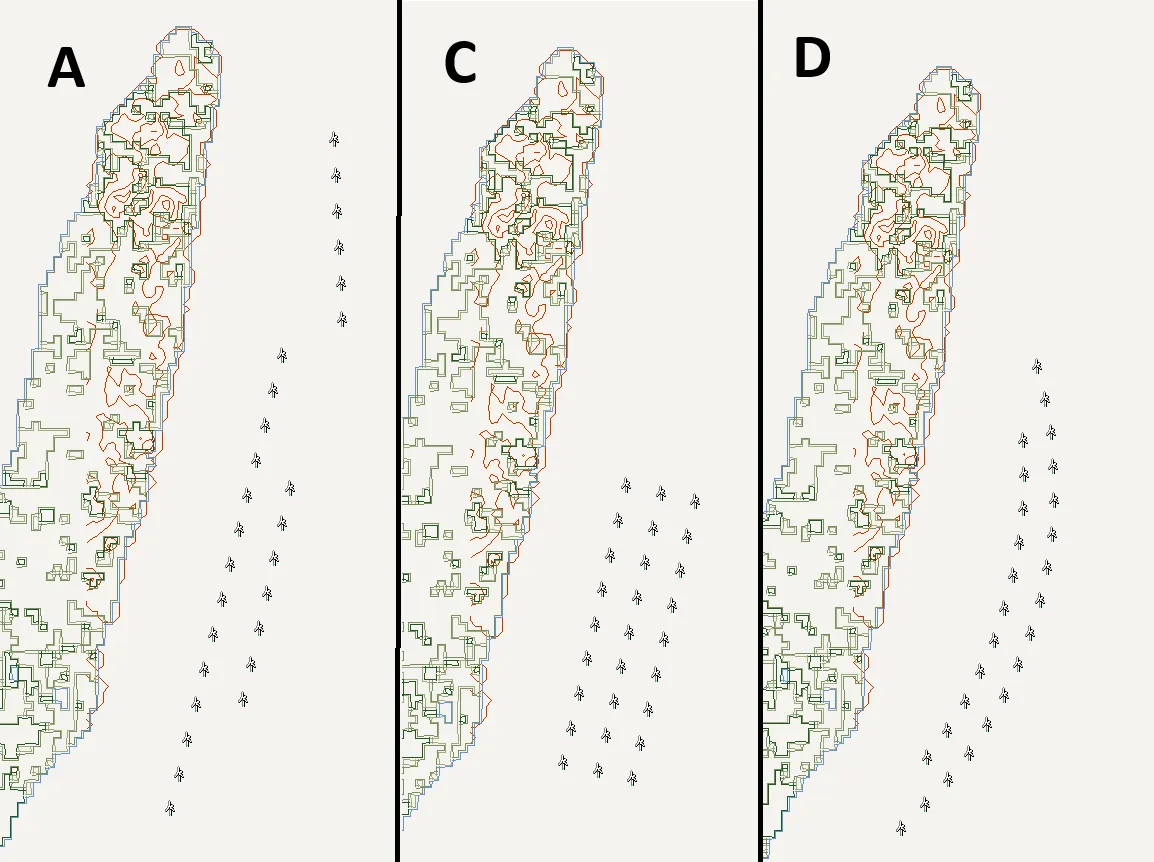
Three layouts with 27 turbines each were compared, with turbines spaced at least 6.1 rotor diameters apart:
| Layout | Design | Wake loss (WAsP) |
|---|---|---|
| A | Three rows across both sites | 4.04% |
| C | Three straight rows | 7.30% |
| D | Two curved rows | 5.49% |
Wake losses calculated in WAsP for the three layouts, before any other losses.
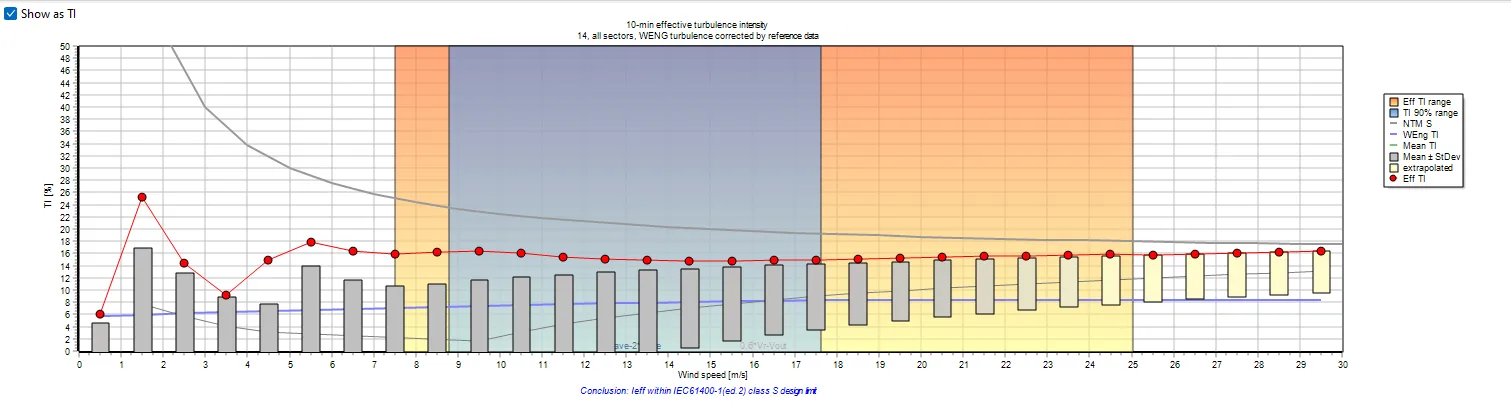
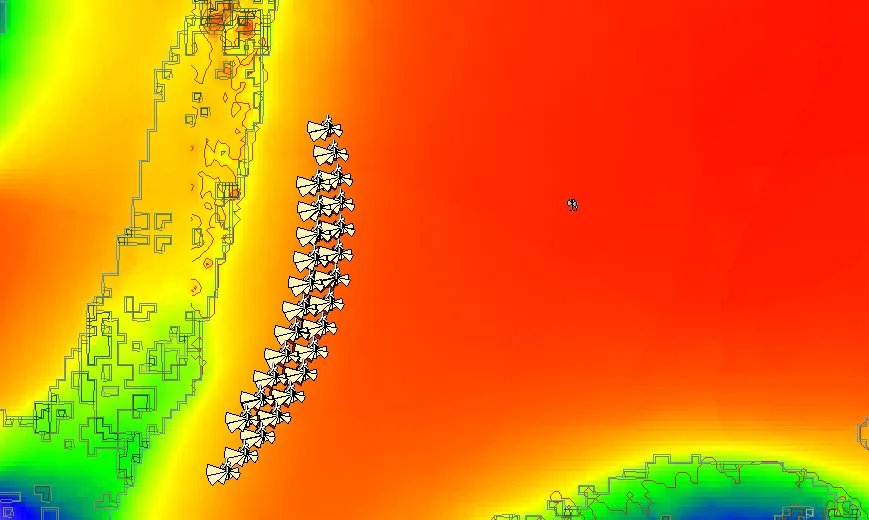
Layout A had the lowest wake loss, but its turbines are split by the shipping lane, which means extra cables. Layout D was chosen: two curved rows inspired by Middelgrunden, which also has the least visual impact. In the IEC site assessment, class IB failed the wind speed distribution check, and the effective turbulence corrected with mast data also exceeded IB. The site therefore needs an S-class design, which the V164 already uses.
Energy yield
With layout D fixed, the analysis added technical losses (availability, transmission, degradation and electrical, about 7.5% in total) and an uncertainty budget of 15.7%. This combines wind-speed uncertainty (8.7%, mainly from only two years of data and the 51 m mast being far below the 105 m hub height) and other sources (7.9%). WAT then gave the yield at three confidence levels:
| Confidence level | Gross AEP | Net AEP (all losses) | Total loss |
|---|---|---|---|
| P50 | 844.6 GWh | 788.4 GWh | 10.9% |
| P75 | 790.6 GWh | 701.9 GWh | 11.2% |
| P90 | 705.7 GWh | 623.8 GWh | 11.6% |
Annual energy production of layout D calculated in WAT. P90 is the yield exceeded with 90% probability.
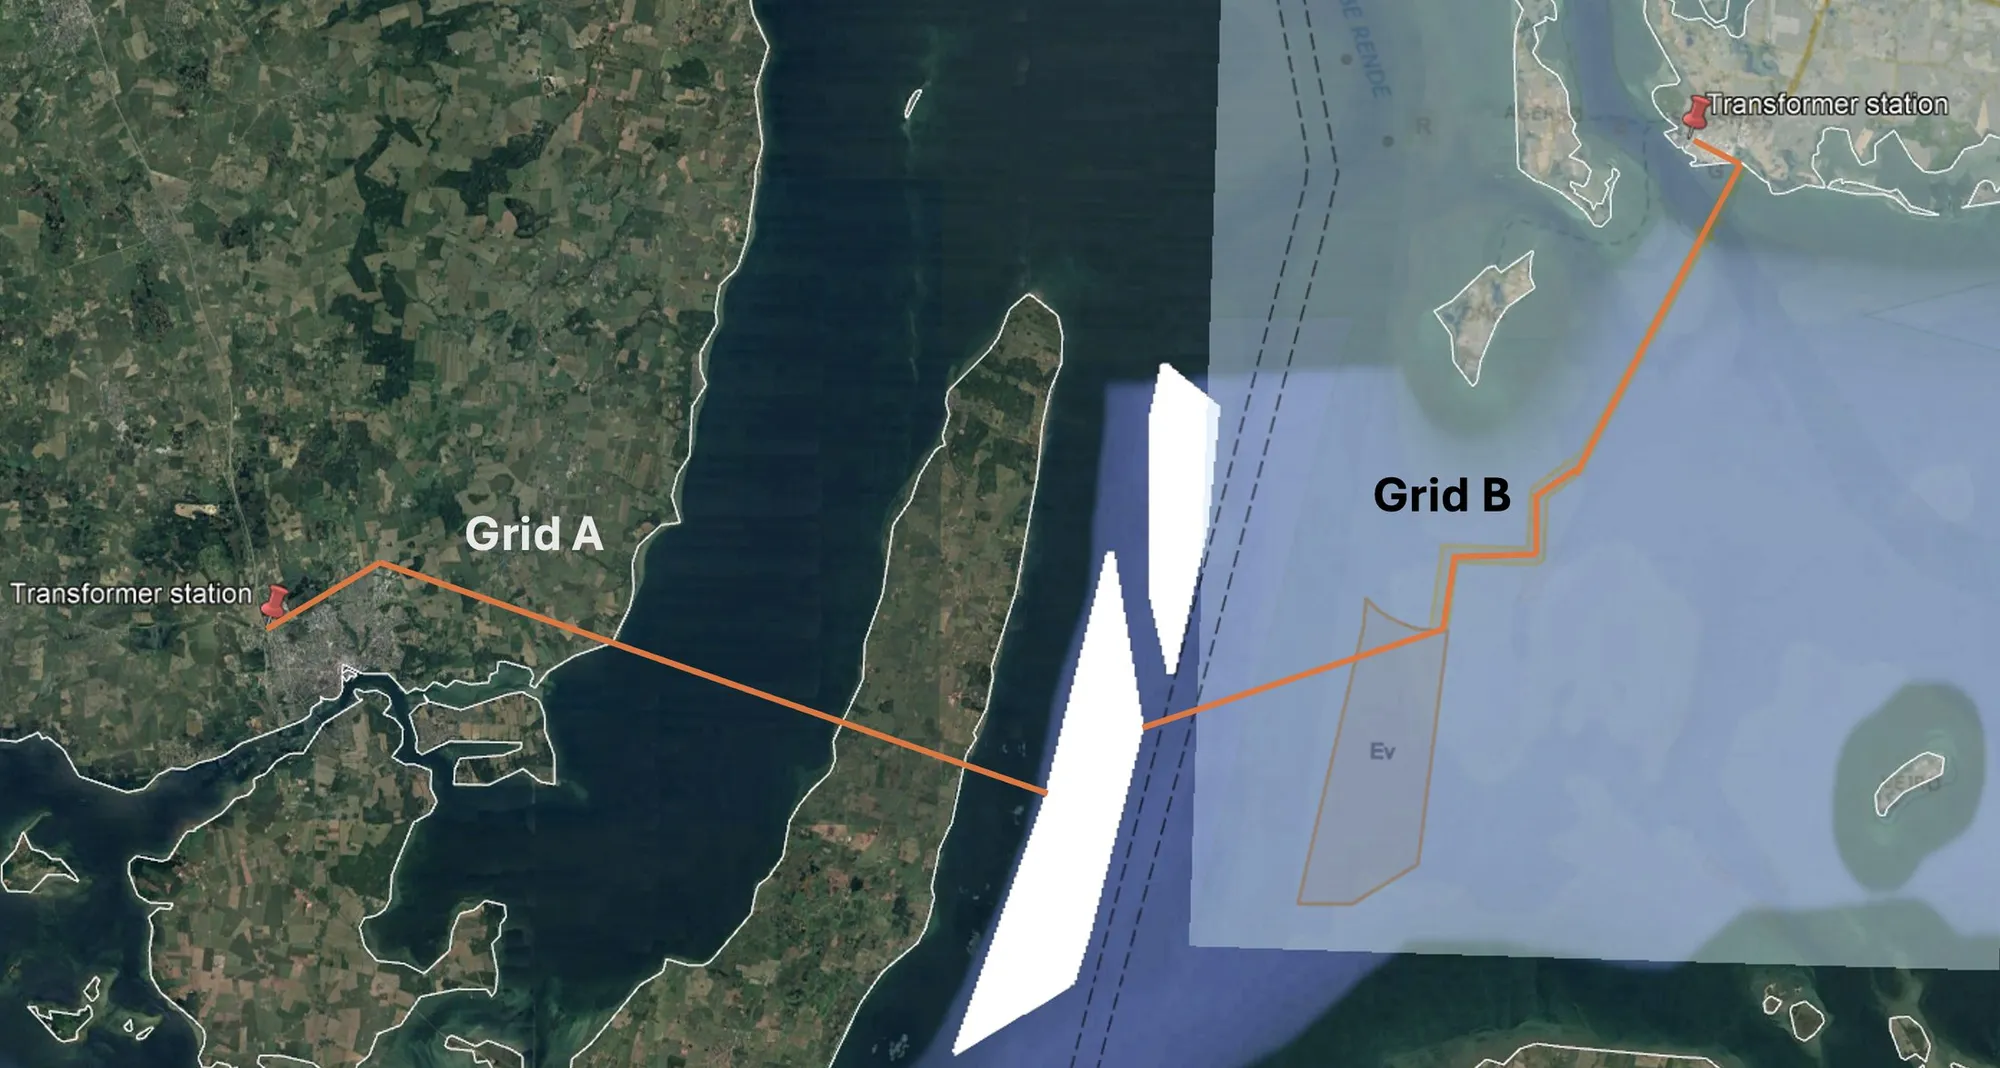
The farm would connect to the 132–150 kV grid, either at Svendborg (25.7 km of cable) or at Stigsnæsværket (29.4 km, along an existing approved cable corridor). The water is 14–20 m deep, so monopiles were recommended, with a gravity base as the fallback if the glacial seabed proves too costly to drive piles into.
Result
With these yields, the economic model gave a levelised cost of energy of 89–125 €/MWh, depending on lifetime and confidence level. The global offshore average in 2023 was about 78 €/MWh. With a contract-for-difference strike price based on the Vesterhav auction, the net present value was negative in every scenario, so the farm was judged not feasible under these assumptions. A sensitivity study showed that, at P90, it would only break even at about 165% of the assumed electricity price, or at about 45% of the assumed construction cost.