The goal
This DTU course project (02450, 2023) applied the full machine-learning workflow to the Breast Cancer Wisconsin (Diagnostic) dataset: 569 tumour samples, each described by 30 measurements of the cell nuclei in a biopsy image. The main question was whether a tumour can be classified as benign or malignant from these measurements, and which model does it best. It was an academic analysis of a public dataset, not a clinical diagnostic tool.
My involvement
The work covered the data visualisation and principal component analysis, the regularised linear regression of the nucleus radius, the neural-network and logistic-regression classifiers in Python and PyTorch, and the two-level cross-validation and statistical tests used to compare the models.
Exploring the data
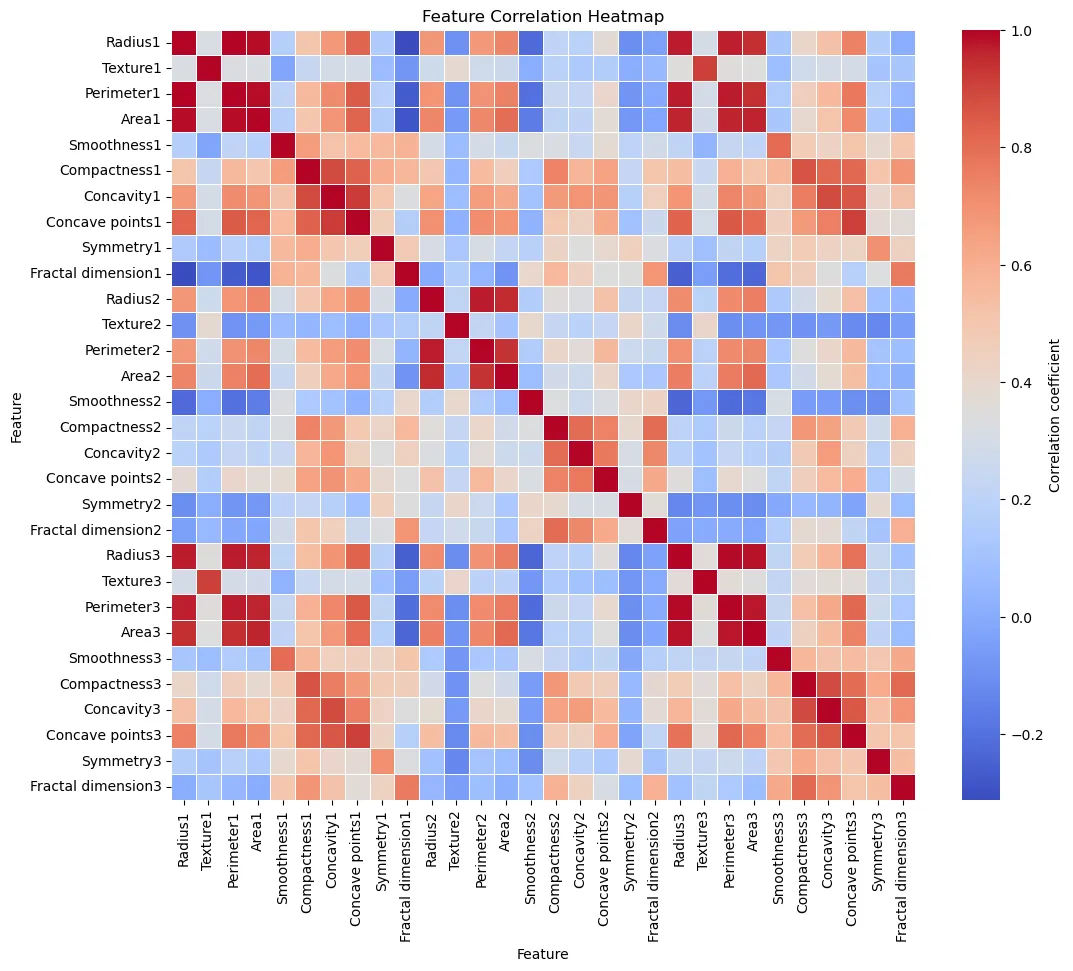
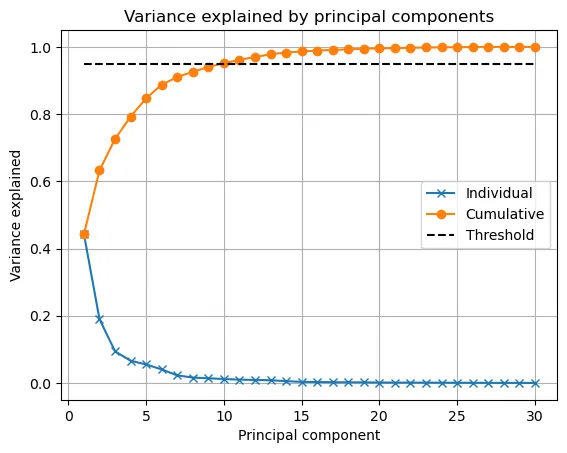
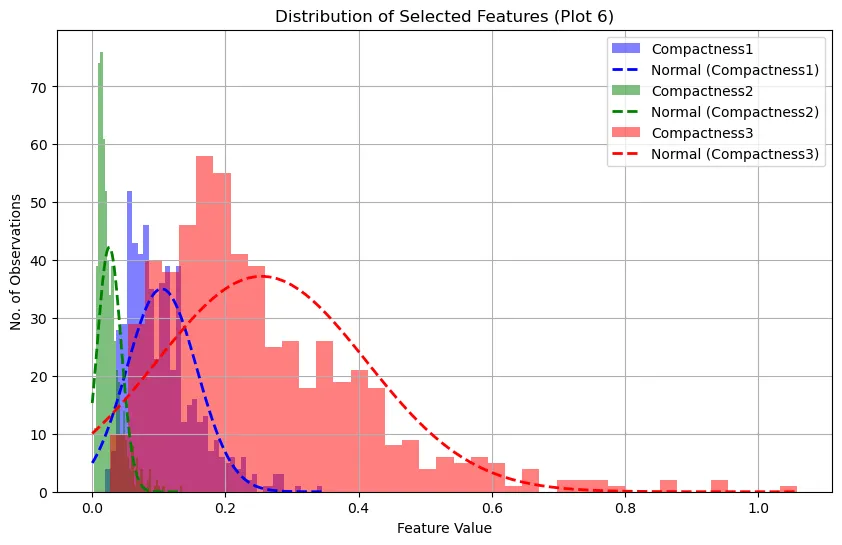
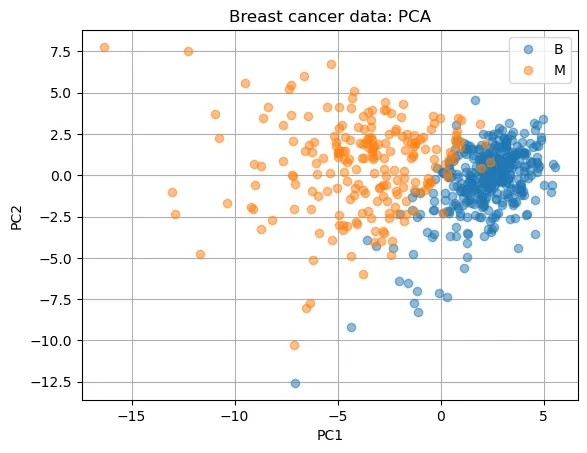
The features span very different scales, from smoothness values around 0.1 to areas around 500, so all data were standardised. A correlation analysis showed groups of strongly related features, and a Principal Component Analysis showed that two components already capture about 65% of the variance. Projected onto those two, benign and malignant samples separate almost linearly, a strong sign that classification would work.
Regression: predicting the nucleus radius
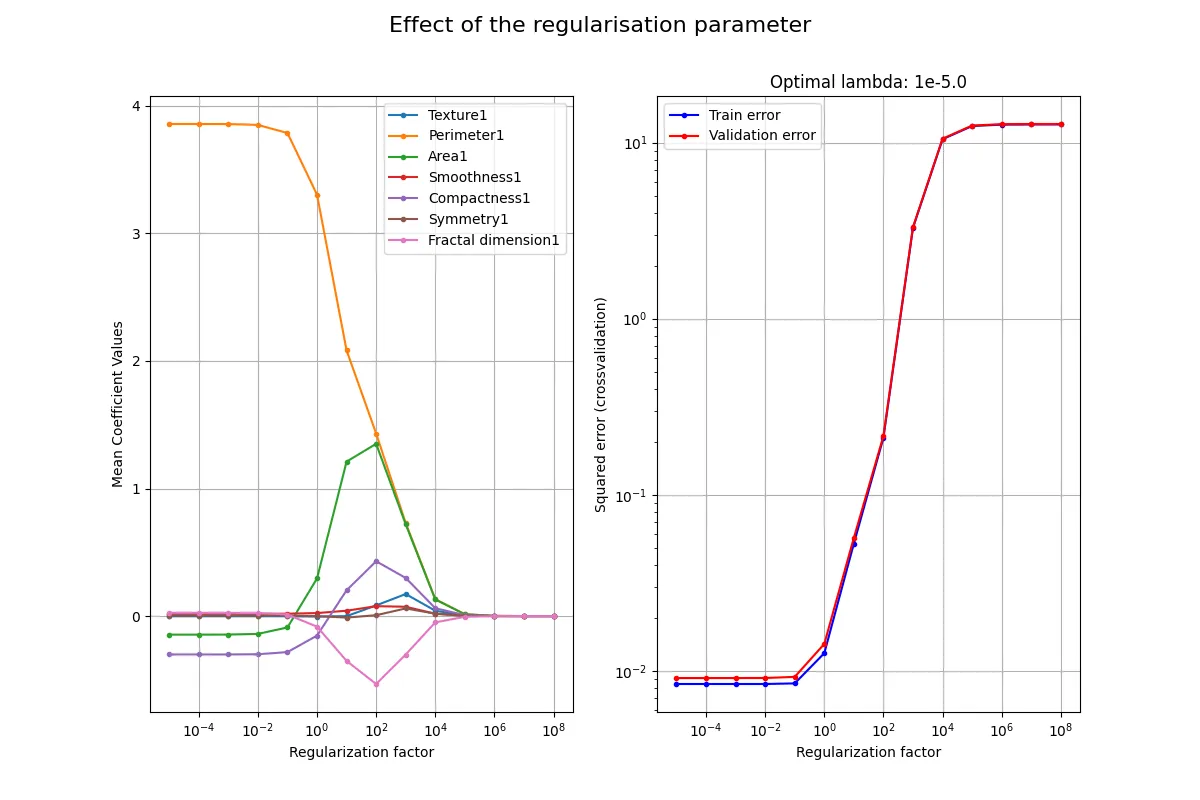
As a regression task, the radius of the nucleus was predicted from seven other features, with the regularisation strength λ selected by 10-fold cross-validation. The model relies mostly on the perimeter, and regularisation had almost no effect. In a two-level cross-validation (10 outer × 10 inner folds), both the linear model and a neural network reached squared errors around 0.008–0.009, against about 12 for a baseline that predicts the mean. The difference between the neural network and the linear model was significant in only one of the ten folds.
Classification: benign or malignant
The same two-level cross-validation compared three classifiers, with each model’s complexity (network size, or the regularisation λ) selected in the inner loop:
| Model | Mean test error | Mean accuracy |
|---|---|---|
| Neural network | 2.6% | 97.4% |
| Logistic regression | 7.4% | 92.6% |
| Baseline (majority class) | 37.3% | 62.7% |
Averages over the ten outer folds. Per-fold accuracies ranged from 91–100% for the neural network and 83–98% for logistic regression.
Pairwise McNemar’s tests confirmed that both models clearly beat the baseline. Between the neural network and logistic regression, however, the difference was significant in only one of the ten folds. The network had the lowest error, but the statistics did not show it to be reliably better.
Result
The neural network classified tumours with 97.4% average accuracy, in line with the 97% reported by the dataset’s original authors. The most useful lesson was methodological: a lower error rate is not the same as a better model until a statistical test supports it.